🎁 Free 30-day publishing fees on Pay-As-You-GO. Get 15% off when recruiting from the UserQ Panel, with code HELLO15

You’ll have access to the results as soon as the test is published. The findings of your test show how easy (or confusing) it is to navigate your site – including how many testers successfully completed the task, how long it took them, and the pathway they chose before selecting an answer.
Here’s how to analyse your survey answers.
Step 1: find the survey you want to analyse
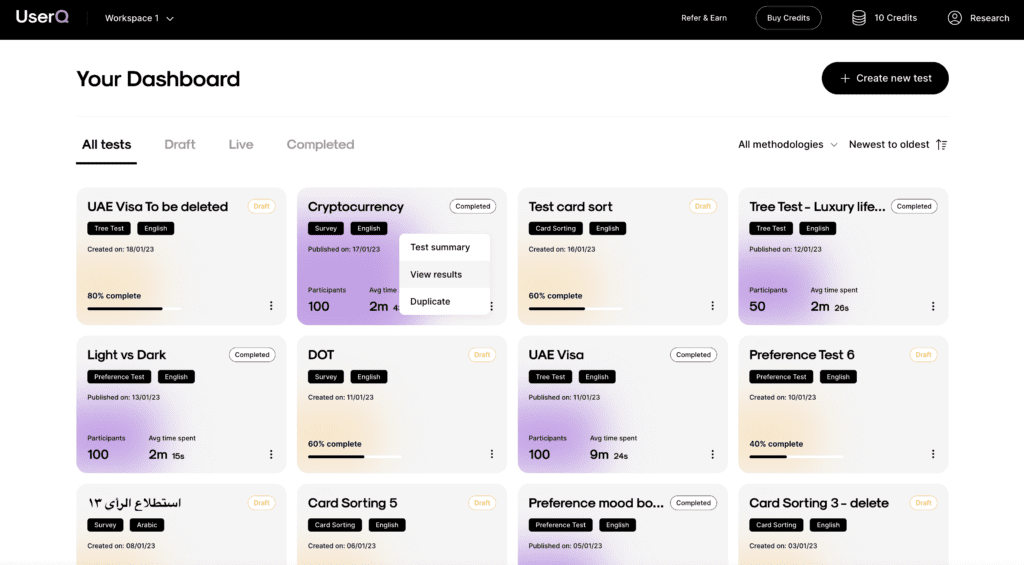
- From your personal dashboard, click on the settings menu of the survey you want to analyse.
- Select ‘View results’.

Step 2: examine the survey overview
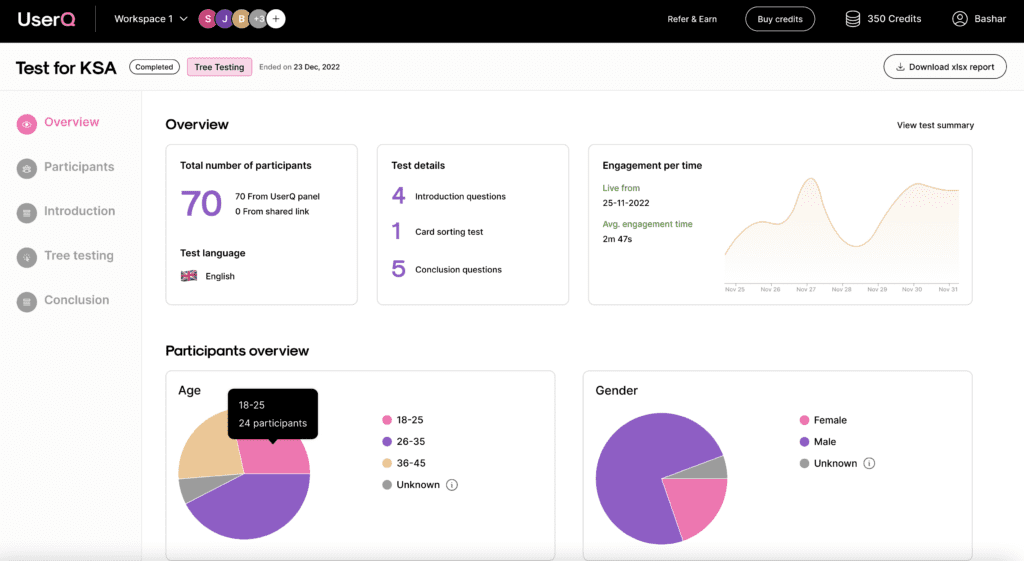
Under the ‘Overview’ tab, you’ll find a general summary of your survey results, including information such as:
- the total number of participants
- the total number of participants from UserQ/shared link
- a timeline results graph
- a short summary of test details (number of tasks, introduction questions, conclusion questions).

Step 3. Examine participant data
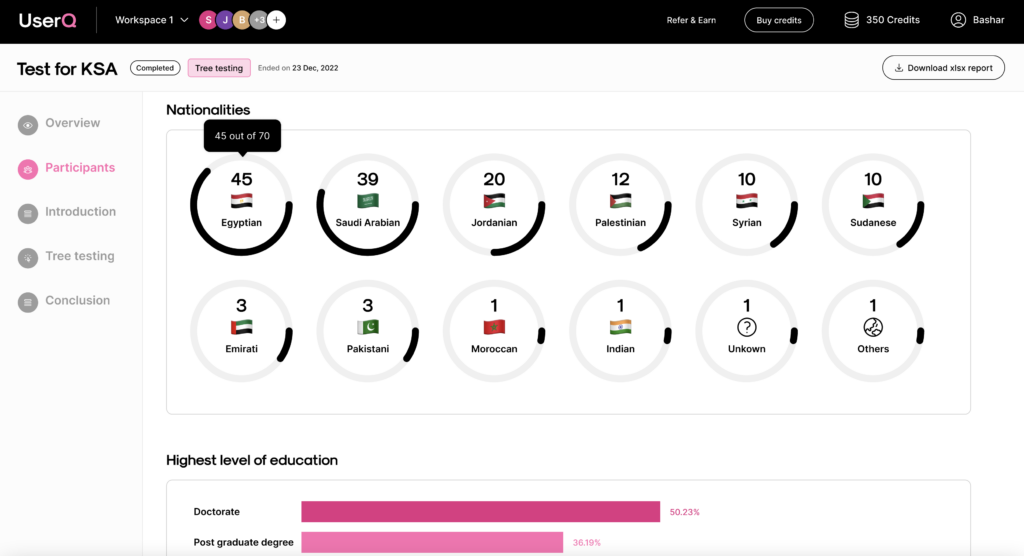
If you’ve used the UserQ panel, under the ‘Participants’ tab, you’ll find information on who took part in your survey, including information such as:
- gender
- age
- nationality and residency
- current employment status (and industry, department)
- household status and income
- and more.
If you’ve used a shared link only, this section will be empty.

Step 4. examine the survey results
Under the ‘Survey results’ tab, you’ll find details on the answers that participants gave to each of your questions.
Depending on the type of question, you can view the answers in a variety of ways: in a chart, as aggregated data, or by user.
View the answers to each question by clicking the left and right arrow buttons OR from the dropdown menu where you can select the name of the question.

Here’s a closer look at how the results of each question type can be viewed…
a. Free text
- the total number of answers
- the exact written answer that each individual participant input
- the time spent answering the question, and the answer completion date.

b. Single-choice
- the total number of answers (just beware that the number of answers given for a single question may vary from the total number of participants because some might skip a question or the use of logics can take them elsewhere).
- a pie chart illustrating what proportion of participants answered with each answer choice (hover over each pie segment to see the exact number of participants)
- aggregated data, including the total number of responses for each choice, % total, number of participants sourced from the UserQ panel, and number of unknown participants (from shared link)
- by each individual user, including their unique answer, time spent answering the question, and the answer completion date.

Tip: you can hide an individual participant from your data. Click on the settings menu of the participant you want to hide and select ‘Hide participant’ then ‘Confirm’.
Just beware that hidden users are only invisible from a single question input. The single entry doesn’t get deleted.
Alternatively, you can report the participant by selecting ‘Report participant’. Let us know the reason (ie. use of offensive or vulgar language) and select ‘Report issue’. Once our support team reviews the report request, they will either issue a refund or contact you for further information.
c. Multi-choice
- the total number of answers
- a horizontal bar chart illustrating what proportion of participants selected each option (hover over each bar to see the exact number of votes)
- aggregated data, including the total number of responses for each choice, % total, number of participants sourced from the UserQ panel, and number of unknown participants (from shared link)
- by each individual user, including the answer(s) they selected, time spent answering the question, and the answer completion date.

d. Likert scale
- the total number of answers
- a chart illustrating the proportion of participants that voted for each rating (hover over each bar to see the exact number of participant (this applies for each statement which is shown in its own individual chart)
- aggregated data, presented as a visual comparison between the different statements, including the % voted rating for each statement.
- by each individual user, including the a they selected, time spent answering rating the statement, and the answer competition date.

e. Rating scale
- A chart illustrating the proportion of participants that voted for each rating (hover over each bar to see the exact number of participants)
- Satisfaction score: This rating measures the level of approval/satisfaction participants have expressed toward your question.
Calculation = (*Satisfied users / Total users asked)x100
*Satisfied users are those who have rated a 9 or 10 on a 10-point scale or 4 or 5 on a 5-point scale. - Net score: This metric evaluates the difference between the percentages of extreme positive and negative responses on a rating scale.
Calculation = % Enthusiasts – % Critics
For a 10-point scale, enthusiasts are defined as those who rated 10 or 9, while critics encompass ratings from 1 to 6. On a 5-point scale, promoters constitute those who rated 5, whereas critics include ratings from 1 to 3.
- Total number of ratings
- Ratings given by individual users
- Average: This formula calculates the average rating given by participants.
Calculation = Sum of ratings given / Number of total responses

f. Ranking scale
- the total number of answers
- overview of which answer(s) were ranked highest
- a chart illustrating the scores each option received and the percentage it was ranked at each specified rank (#1, #2, and so on). Think of the scores as weighted averages which represent the average ranking of each option. The option that’s ranked #1 the most will have the largest weighted score.
Want to know how the scores are calculated? Here’s how the basic calculation goes…

Step 5. examine introduction/conclusion questions
Last but not least, if you’ve added any introduction/conclusions, take a look at the answers you received under the ‘Introduction questions’ and ‘Conclusion questions’ tabs.
For introductory and conclusion questions, you can simply rely on the qualitative descriptions above based on the different kinds of questions you’ve asked.
Build your UserQ survey today
Ready to build your survey with us? Join as a researcher and the consumer feedback you need will soon start rolling in.
Need some assistance with building your survey questions? Send a message to: support@userq.com to get in touch. We’re always happy to answer any queries you might have.
Related Post

Tree testing guide: How to
Want to build a fully functional tree test the easy way? Here at UserQ, we’ve got the tools you need

Tree testing guide: Analyse tree
You’ll have access to the results as soon as the tree test is published. The findings of your test show

Card sorting guide: How to
Want to build simple and easy-to-use card sorting tests? You can with UserQ. Our pay-as-you-go user testing platform allows you
Subscribe to our
product newsletter!
Receive emails about UserQ updates, new features,
offers and latest trends.


