🎁 Free 30-day publishing fees on Pay-As-You-GO. Get 15% off when recruiting from the UserQ Panel, with code HELLO15
Need feedback on designs or prototypes that you’ve already built? Want to design a digital product you know your users will love? We recommend carrying out a preference test with our easy-to-use UserQ platform.
But what is a preference test and what does it involve? Most importantly, how can preference tests help you make smarter, more informed design decisions when creating a super user-friendly design for your digital products?
In this how-to guide, we take you through a step-by-step tutorial to create, run, and analyse a preference test using our platform.
What is a preference test?
Also known as A/B testing, the aim of a preference test is to uncover which designs your participants prefer over others – and the reasons behind their choices.
Preference tests are usually carried out as a measure of visual appeal, however, they can also be useful for gaining thoughts and opinions on your overall brand identity – and how well you communicate a message.
These types of tests are most beneficial earlier on in the design stage, when you’ve still got plenty of time to make amendments based on the feedback you receive. Best of all, our UserQ preference tests are built to give you both quantitative and qualitative feedback – not just what designs they prefer, but also why this might be.
What does a preference test involve?
The test involves participants being shown a variety of design options (usually between two to five options) and then asked which one(s) they personally prefer, as well as dislike. You can ask more in-depth questions to understand the reasons behind their preferences.
The designs that you show participants depends on what feedback you’re after. The test can ask for opinions on a variety of design features, including but not limited to:
- logos
- colour schemes
- fonts and typographies
- images and graphics
- videos
- packaging
- website branding.
What questions should you ask?
We recommend asking questions that pinpoint specific aspects:
For example, if you want feedback on general aesthetics, you could ask: “Which design do you enjoy looking at most?” or “Which design is most pleasing on the eye?”
If you want feedback on emotion and how your designs make people feel, you can ask: “Which design evokes the most sincerity?” or “Which design makes you feel more joyous?”
And if it’s feedback on specific design aspects like font or colour palettes, you can ask: “Which font is easier to read?” or “What colour palette looks most professional?”
Remember, your participants aren’t UX or design professionals. Preference tests are to gain user-centric feedback from the perspective of your user. They won’t be qualified to know what’s objectively a good design, but their feedback does provide useful insights into what resonates most with your users. This is especially true if you use our UserQ panel where you can specifically recruit participants in the right demographic needed to make your gatherings more reliable. But more on this later.
How to run a UserQ preference test
Now that we’ve explained exactly what a preference test is, it’s time to create yours…
Step 1: create a new test
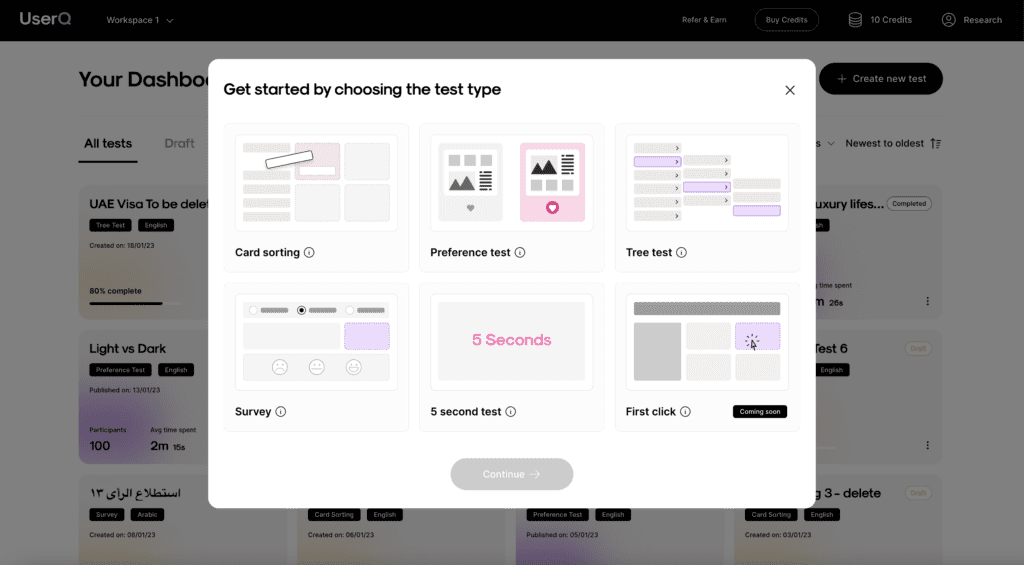
From your personal dashboard, click ‘Create new test’ and then ‘Preference test’.
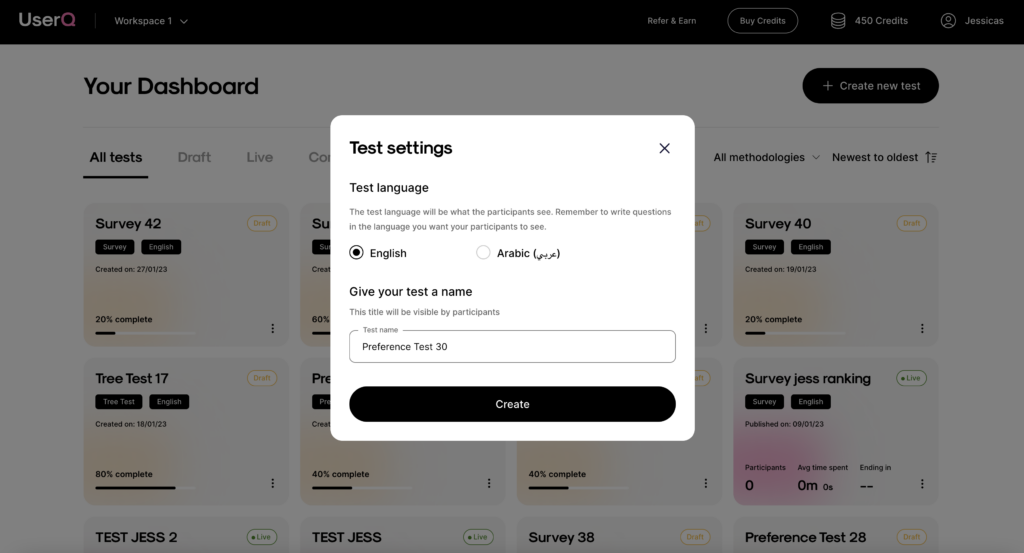
- Select your test language (English or Arabic) and name your new test. While the researcher platform will not show in Arabic, the entire participant experience will be Arabic-friendly (from right to left). If you do choose Arabic, remember to switch your keyboard to Arabic and make sure that all your test inputs are written correctly.
Tip: remember, your preference test name is visible to participants.
Step 2: edit your welcome page
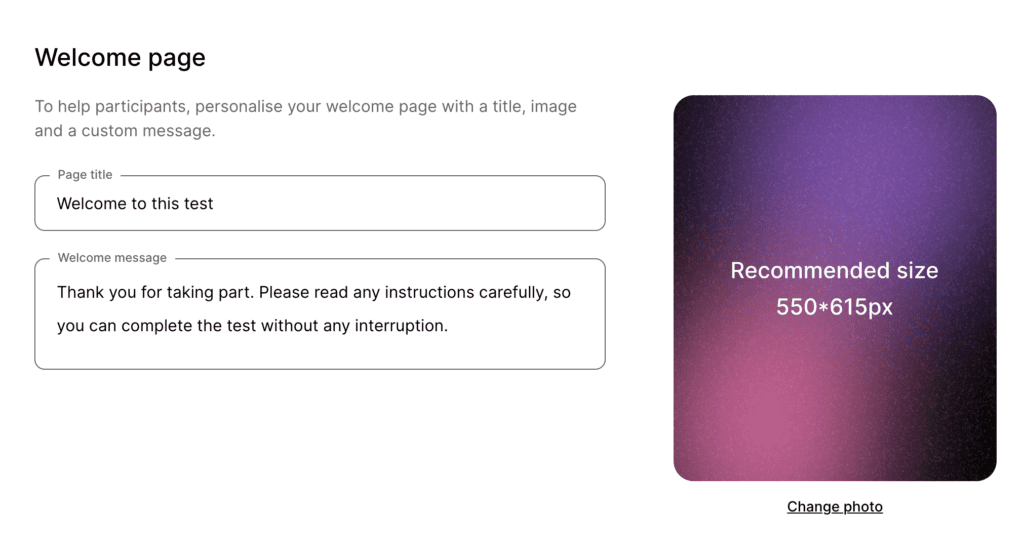
This page is a chance to put participants at ease and tell them a little bit more about what the test involves and what’s required of them.
A generic title and description are already pre-populated. You have two choices: to proceed without making any changes to the default text, or personalise your own…
- Add a welcome page title, and write a custom welcome message.
- Add a photo to give the user visual cues about the test.
- If the language is set to Arabic, the pre-populated text will already be translated into Arabic too – so remember to write in Arabic if you want to make changes.
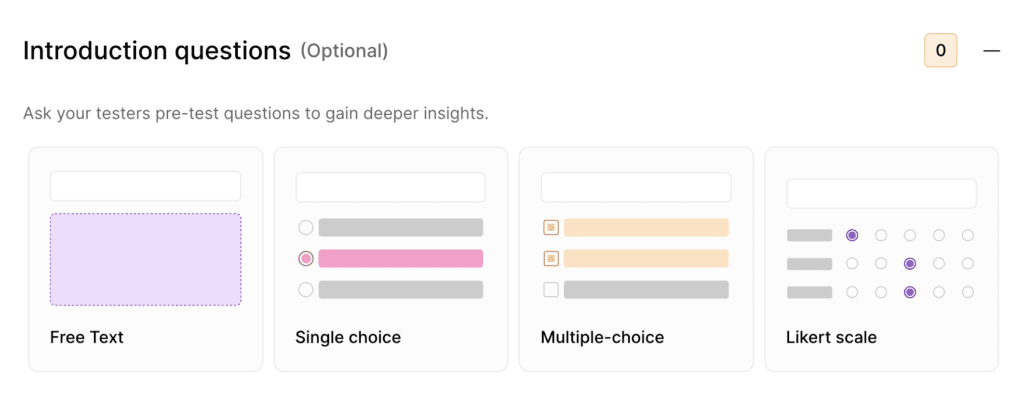
Step 3: add introductory questions (optional)
These are a chance for you to gain deeper insights into who your participants are and if they’ve got any general thoughts on design.
- Add custom questions that you want to ask participants before the preference test begins.
- There are six types of questions you can choose from: Free text, Single choice, Multiple-choice, Likert scale, Ranking scale, and Rating scale.
- We’ve set a maximum of five introductory questions because we don’t want your participants to lose attention before the main test even starts.
Step 4: create the task
Everything you create for the preference test will be found under the ‘Test builder’ tab.
- Write out the task in the ‘Task description’ box.
- For example, you might ask something simple like: “Which design do you prefer?” or a little more specific like: “Which logo design option looks the most professional?”

Tip: the task description is your chance to let participants know the purpose of the task and what the designs are about, ie. a logo, website page, etc. It’s better for them to know exactly what they’re looking at so they can make more informed decisions on which one they like best.
Step 5: upload the designs
Next it’s time to select the designs that participants will choose from. There are few different ways the design images can be shown.
- Select whether you want to ‘Randomise the order that designs are shown to participants’.
- Select whether you want to ‘Show designs one at a time’ (if not selected, by default the participants will be shown a list they click on to get a full view).
- Select whether you want to ‘Show design titles to the participants’ (if selected, they’ll be shown an automated default title which you can customise).
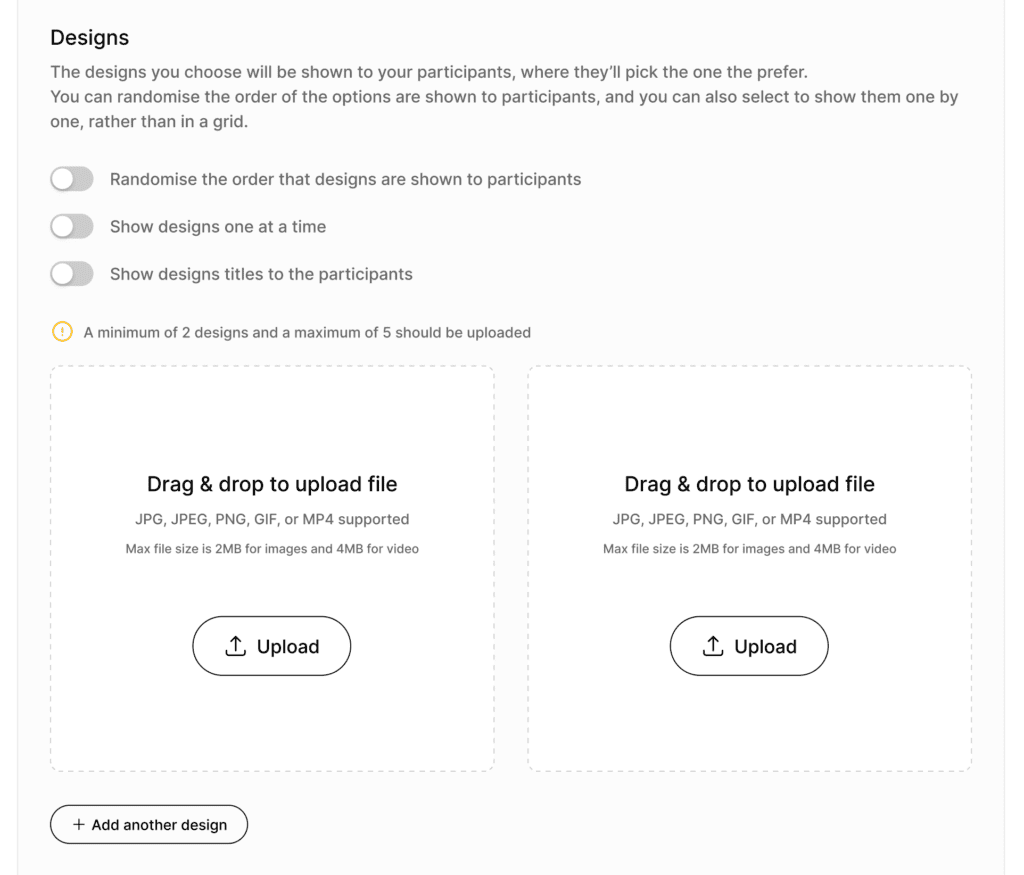
Tip: we recommend showing design titles wherever possible. That way you can refer back to specific images in any follow-up questions, without participants getting confused about which one’s which.
After you’ve selected the above settings, it’s time to upload the image files…
- Drag and drop to upload the file OR press the ‘Upload’ button to upload the file from your computer drive.
- Change the title in the edit box (if you’ve selected ‘Show design titles to the participants’)
- Add and edit the background colour (it’s a good idea to select a darker or bolder background colour to contrast a white logo).
- You can upload a minimum of two designs and a maximum of five designs. Having more than five to choose from can be overwhelming for your participants.
- The file formats supported are: JPG, JPEG, PNG, GIF, or MP4.
- The max file size is: 2MB for images and 4MB for video.
Tip: preview your test along the way by clicking on the ‘Preview text’ button. That way you get to see exactly what your participants see. Notice something not quite right? You can then go back and change it.
Step 6: write follow-up questions
A chance for you to gain qualitative data regarding the choices participants have made about your designs.
For example, the test task might provide the quantitative data needed to prove one specific design is definitely the favourite amongst participants – but without the follow-up questions, you won’t have any idea as to why they liked it, how it made them feel, or why they preferred it over the others.
Writing your post-test conclusion tests works exactly the same as your pre-test introductory questions.
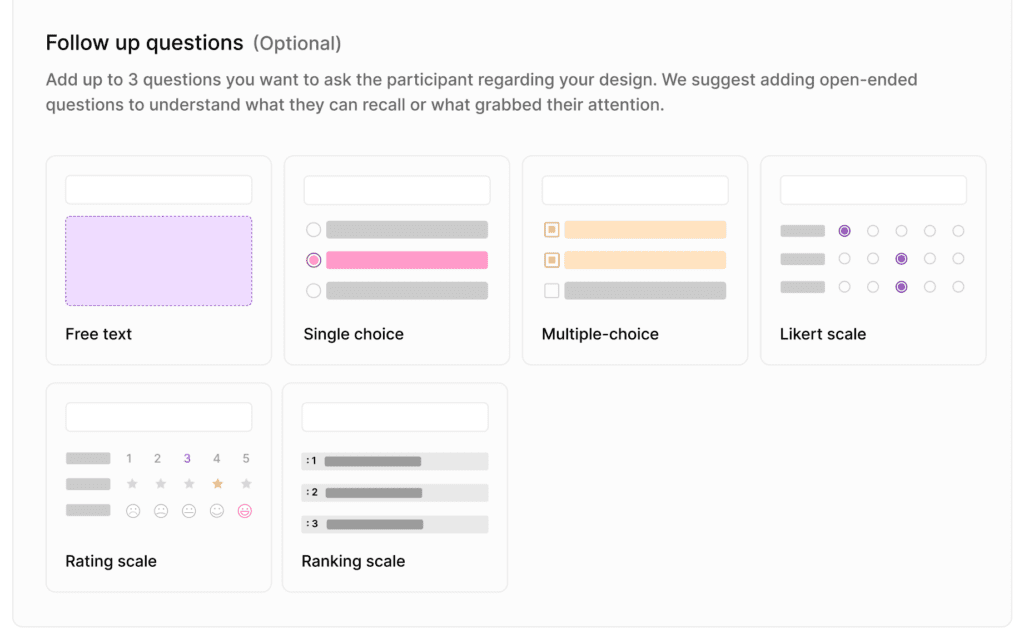
Tip: we think open-ended free text questions work best for preference test feedback. They’re perfect for getting extensive and in-depth subjective opinions from your participants.
Step 7: edit your thank you page
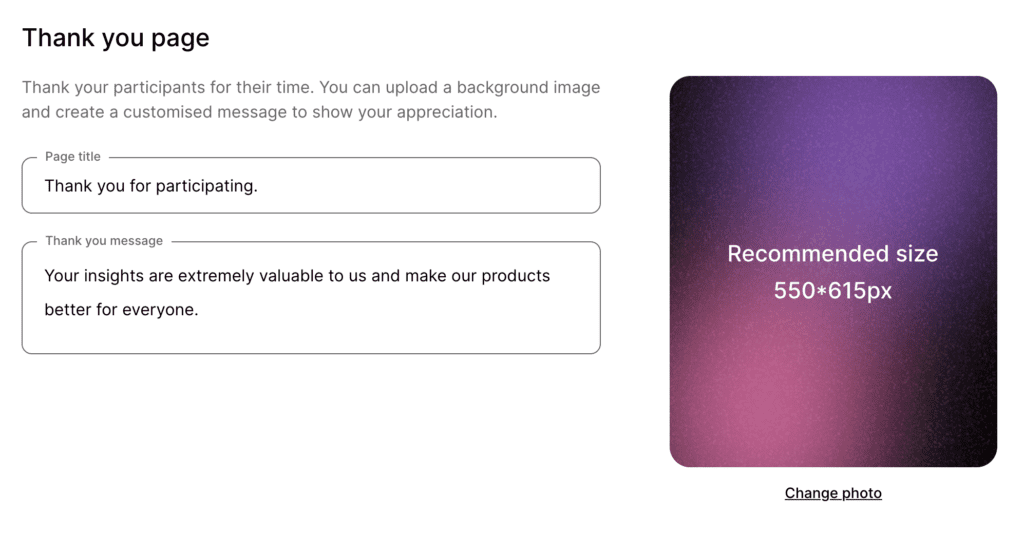
Here you can thank the participants for their time and show your appreciation for taking part.
- Customise the page title
- Write a personalised thank you message
- Add a custom photo.
Step 8: Recruit your participants
You have two choices: you can either recruit from UserQ panel or share the link with your own set of participants.
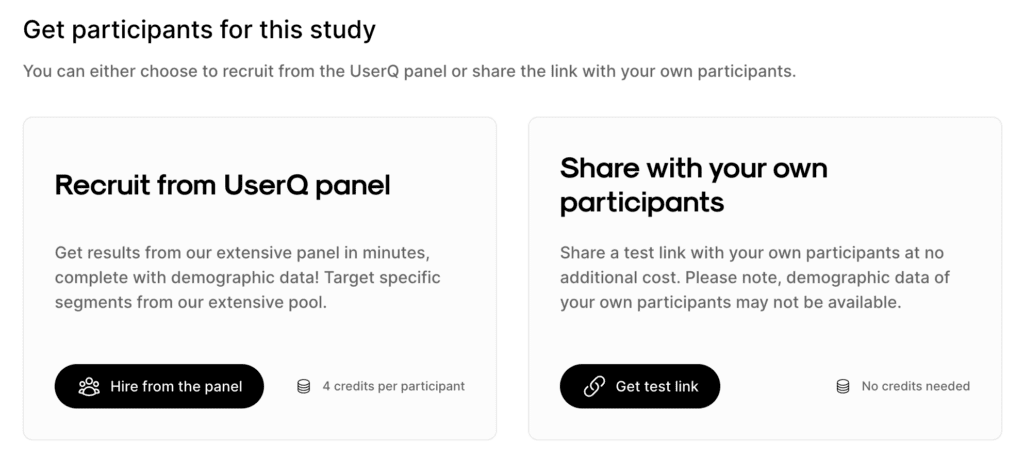
a. Recruit from UserQ panel
If you want to use your own participants, skip to step b.
- Click ‘Hire from the panel’.
- Choose how many participants you want to recruit (four credits per participant).
- You can target participants from a variety of demographics: age, gender, nationality, etc.

i. Filter by demographics
Next, switch on the demographic filtering feature, where you can target participants from a variety of demographics, including age, gender, nationality, etc. Use our estimated panel size widget (on the right) for real-time information on how many testers we have in our pool, based on your selected demographics. It also provides feedback on your survey’s results speed, ie. how long you’ll have to wait to get all the results.
The broader the panel, the faster the results come in.
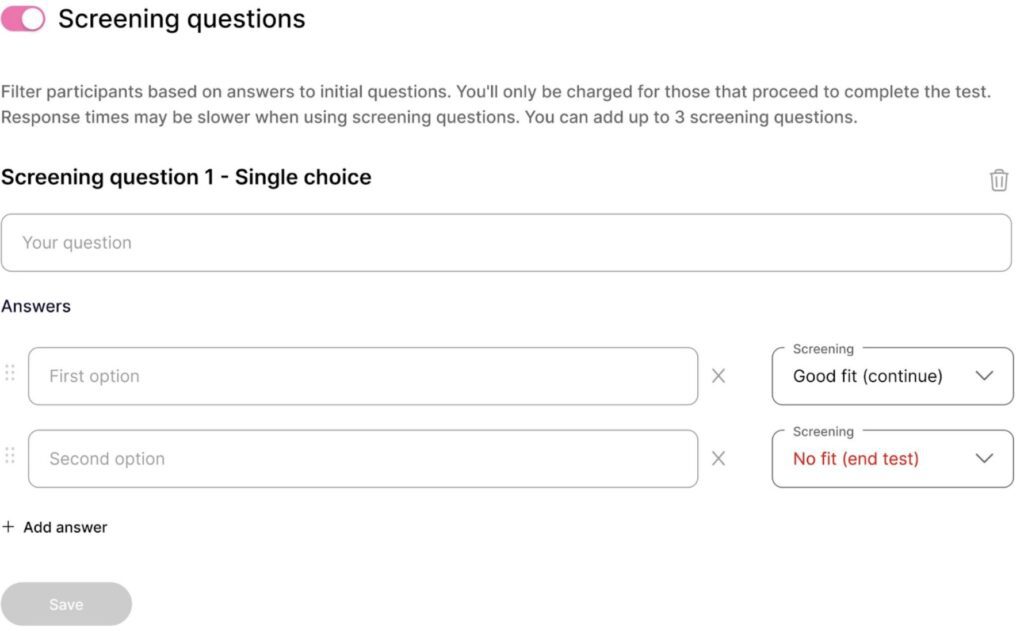
ii. Add screening questions (optional)
Toggle this option, to add screening questions to your study. These questions will appear one-by-one to the tester as ‘pre-test questions’. Their responses will determine whether they are eligible to continue to the study.
You can add up to a maximum of 3, single-choice questions to identify the most suitable participants for your study. Each question can have a maximum of 5 responses and must be classified as either a good fit or no fit.
Good fit = Responses that match your criteria for the study and are eligible to take the test or continue on to the next question (in the case of multiple screener questions). Your credits will be spent only on the “Good fit” participants.
Not fit = Response that are not a good fit for the study and the tester will not be able to access the test. get all the results.
b. Share with your own participants
You can share the link with your own testers panel at no extra cost. However, we recommend recruiting from our UserQ panel due to you getting full use of our wide-reaching participant demographic data, including: age, gender, nationality, residency, confidence with technology, employment status, and household status. By using this data, there’ll be no need for you to ask demographic questions in the test itself.
Step 9: publish
- Review your order summary (including your total participants and required credits for recruitment and publishing fee).
- In the case of an outstanding credit balance, you’ll need to process a payment.
- Once everything’s set up how you want it, click ‘Publish’.
Tip: apply a promo code if you’ve got one.
Congratulations, your preference test is now live.
You’ll get a shareable link for the test, no matter whether you’ve selected a UserQ panel or have chosen your own participants.
Build your preference test today
Are you ready to build your preference test? Join as a researcher and start getting the feedback you need on your designs in just minutes.
Need a hand with building your preference test? We can help.
Send a message to: support@userq.com to get in touch. We’re ready to answer any questions you might have.
Related Post

Tree testing guide: How to
Want to build a fully functional tree test the easy way? Here at UserQ, we’ve got the tools you need
Tree testing guide: Analyse tree
You’ll have access to the results as soon as the tree test is published. The findings of your test show

Card sorting guide: How to
Want to build simple and easy-to-use card sorting tests? You can with UserQ. Our pay-as-you-go user testing platform allows you
Subscribe to our
product newsletter!
Receive emails about UserQ updates, new features,
offers and latest trends.


