🎁 Free 30-day publishing fees on Pay-As-You-GO. Get 15% off when recruiting from the UserQ Panel, with code HELLO15

Analysing your preference test results is vital for gathering the insights needed to take all the comments and feedback on board and use them to improve your designs.
The process can be split into two main parts:
- Use the quantitative data to see which design was the ‘winner’ (if there is one), and which one(s) were least preferred.
- Use the qualitative data of the follow-up questions to find out why participants preferred certain designs. Notice any similar responses or patterns in what people are saying about the designs and their elements/features. Were there any major issues most people pointed out? Was there a clear winner that participants raved about? Were feelings mixed?
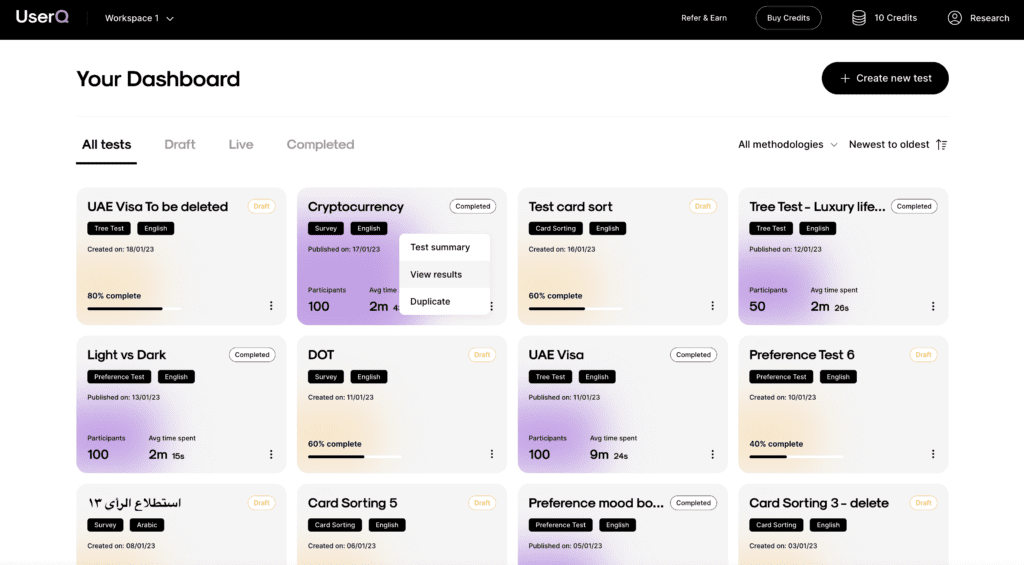
Step 1: find the test you want to analyse
- From your personal dashboard, click on the settings menu of the test you want to analyse.
- Select ‘View results’.

Step 2: examine the test overview
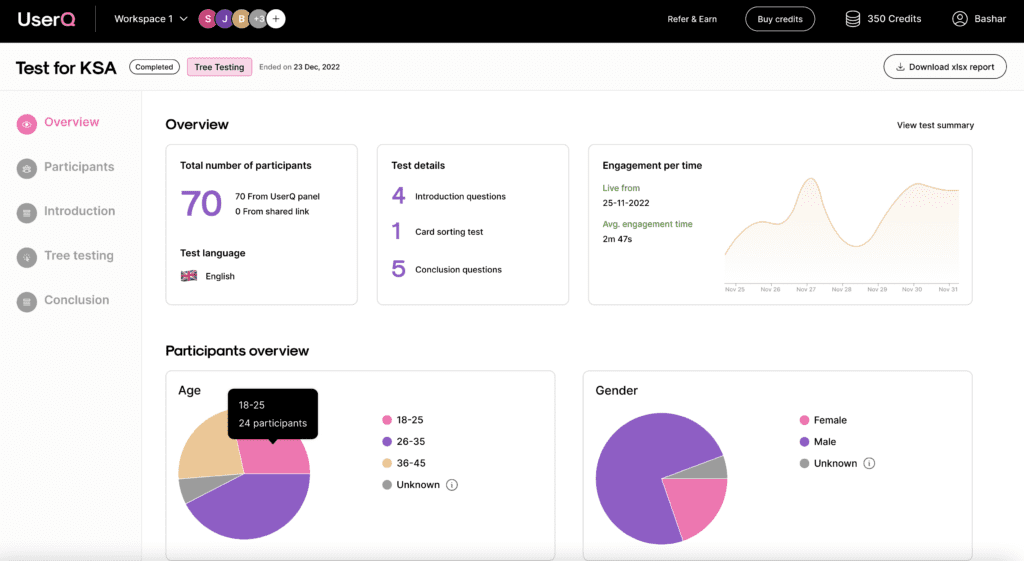
In the test results dashboard, you’ll find all the information and data you need to review the results and come to conclusions.
Under the ‘Overview’ tab, you’ll find a general summary of your preference test results, including information such as:
- the total number of participants
- the total number of participants from UserQ/shared link.
- a timeline results graph
a short summary of test details

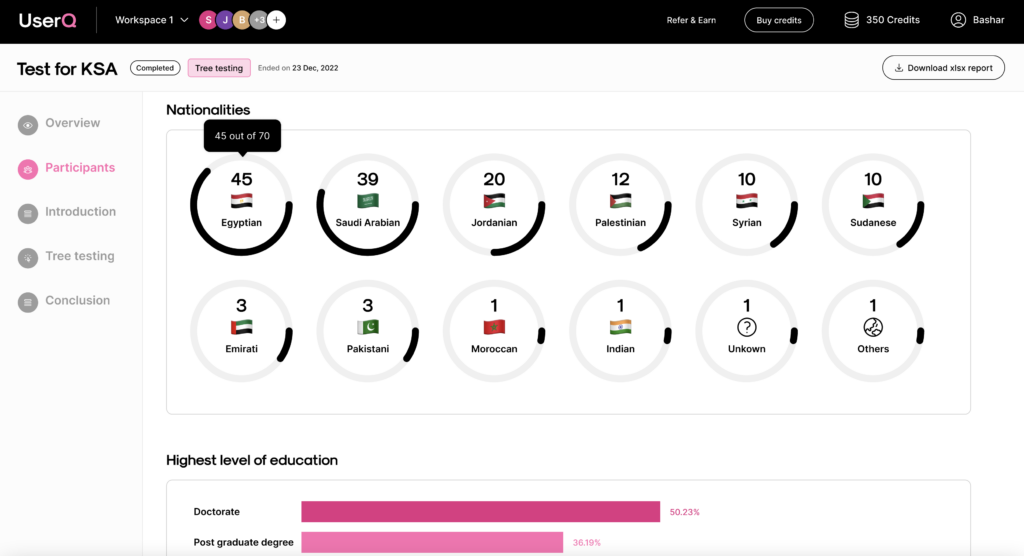
Step 3. Examine participant data
If you’ve used the UserQ panel, under the ‘Participants’ tab, you’ll find information on who took part in your preference test, including information such as:
- gender
- age
- nationality and residency
- current employment status (and industry, department)
- household status and income
- and more.
If you’ve used a shared link only, this section will be empty.

Step 4. Examine preference test results
Under the ‘Preference test’ tab, you’ll see the details on how your participants answered your tasks, including:
- the total number of answers
- the clear answer to which design participants preferred
- by aggregated data view
(shows what % of participants preferred each design, the total number of votes for each design, and the total time spent on each design for all users)
- by user view
(shows what design each individual participant preferred, the design order in which they were shown, the time taken to choose, and the test completion date)

Tip: you can hide an individual participant from your data. Click on the settings menu of the participant you want to hide and select ‘Hide participant’ then ‘Confirm’.
You can also report the participant by selecting ‘Report participant’. Let us know the reason (ie. use of offensive or vulgar language) and select ‘Report issue’. Once our support team reviews the request, they’ll either issue a refund or contact you for further information.
Step 5. examine conclusion questions
Lastly, take a look at the answers for your pre-test introduction questions and post-test conclusion questions.
This is your chance to read through the responses and notice any patterns and similar responses. For example, if the majority of participants answered that they think the colour palette of Design 1 is too dark or dull, chances are they’re right. However, it’s completely up to you whether you take their feedback on board and make amendments.
Build your preference test today
Are you ready to build your preference test? Join as a researcher and start getting the feedback you need on your designs in just minutes.
Need a hand with building your preference test? We can help.
Send a message to: support@userq.com to get in touch. We’re ready to answer any questions you might have.
Related Post

Tree testing guide: How to
Want to build a fully functional tree test the easy way? Here at UserQ, we’ve got the tools you need

Tree testing guide: Analyse tree
You’ll have access to the results as soon as the tree test is published. The findings of your test show

Card sorting guide: How to
Want to build simple and easy-to-use card sorting tests? You can with UserQ. Our pay-as-you-go user testing platform allows you
Subscribe to our
product newsletter!
Receive emails about UserQ updates, new features,
offers and latest trends.


