🎁 Free 30-day publishing fees on Pay-As-You-GO. Get 15% off when recruiting from the UserQ Panel, with code HELLO15

Once the test is published, you’ll have access to the results straight away.
The findings of your card sorting test reveal how users would categorise your website’s information and content. Think of your results as a peek into the minds of your users. Analysing your card sorting results is an intuitive process and as the researcher, it’s your job to find the common patterns, similarities, and differences in your set of results.
You can look at the hard numerical data that tells you exactly what categories were used most (and what categories might be rendered useless)—and then look at the bigger picture and come up with ideas based on how the cards have been sorted and the categories names they’ve come up with.
The method of analysing your test results varies depending on whether you’ve carried out an open or closed card sorting test.
For closed card sorting, you get to see what users think of the existing categories you’ve come up with. You can work out whether users generally understand how you plan to categorise your content, identify the category names that might be unclear or misleading, and also figure out how necessary the categories are. For example, if 0% of participants put cards inside one particular category, you can pretty much render it pointless.
For open card sorting or hybrid card sorting, you’ll see not only the way testers have categorised your cards, but the category names they’ve come up with too. This means you might find a better name for a section or page, thanks to their ideas.
Here’s a step-by-step guide on how to analyse your results for both closed and open card sorting tests…
Step 1: open the test results you want to analyse
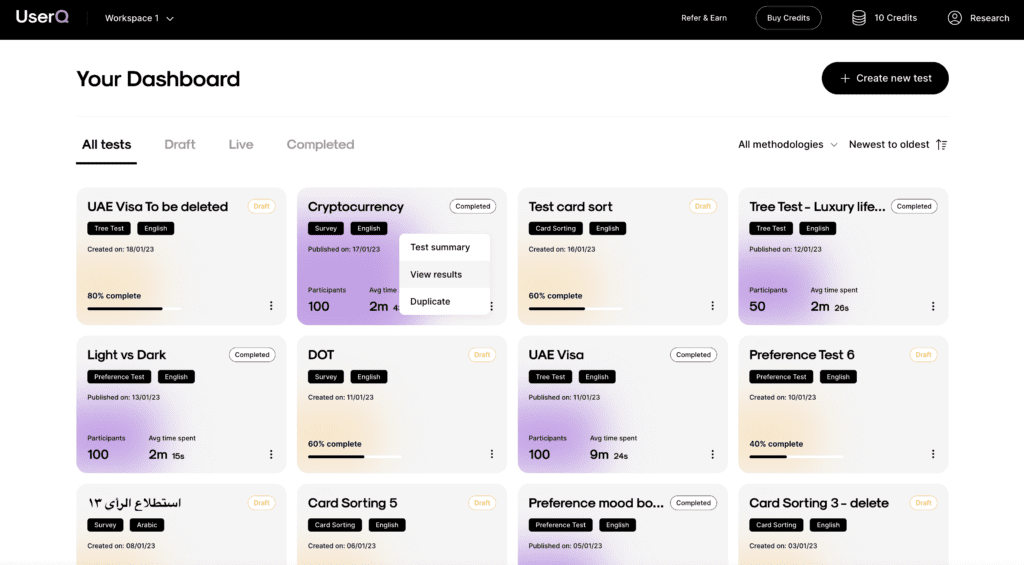
- From your personal dashboard, click on the settings menu of the test you want to analyse.
- Select ‘View results’.

Step 2: review the general results information
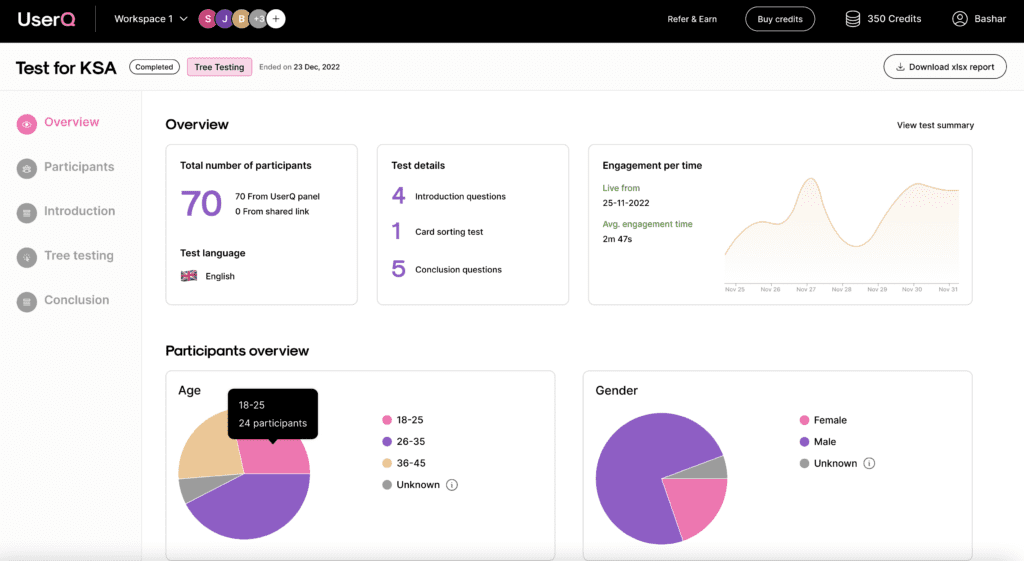
Each card sorting test that you carry out comes with its own individual dashboard…
a. Review the test overview
Under the ‘Overview’ tab, you’ll find a general summary of your test results, including information such as:
- the total number of participants
- the total number of participants from UserQ/shared link
- a timeline results graph
- short summary of test details (number of tasks, introduction questions, conclusion questions).

b. Examine participant data
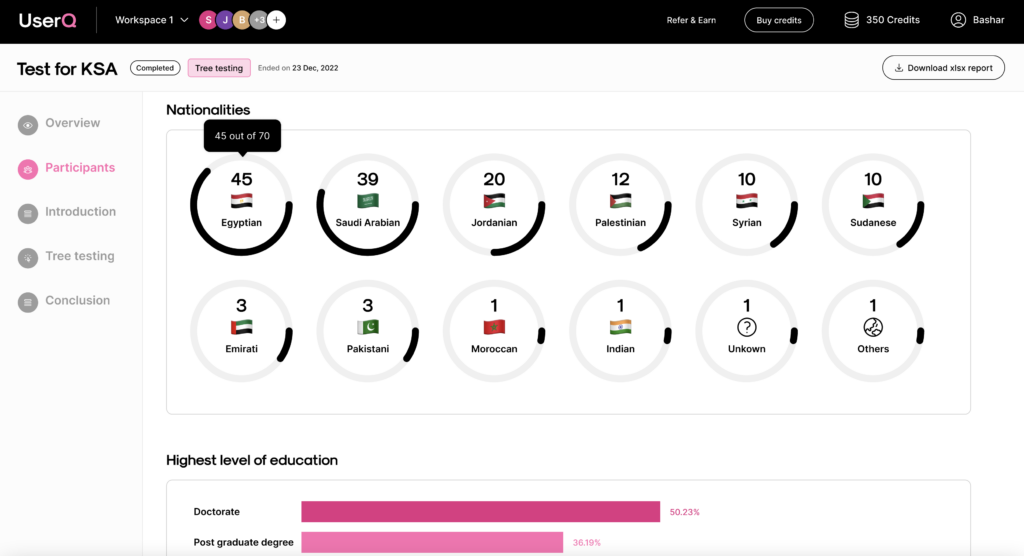
If you’ve chosen to use the UserQ panel, you’ll find all sorts of information on who took part in your test under the ‘Participants’ tab, including:
- gender
- age
- nationality and residency
- current employment status (and industry, department)
- household status and income
- and more.
If you’ve used a shared link only, remember this section will be empty.

Step 3. Review the closed card sorting results
You have two ways of viewing the results of your test: by category or by card.
- You can view the results by clicking on the ‘Closed card sorting’ tab.
a. By category
Viewing the results by category allows you to see what cards were placed in the category and how many times. Under this view, you can see:
- category name
- number of cards (how many unique cards were placed in the category across all the users)
- card names (what cards were placed in the category)
- frequency (how many times each card was placed in the category).

b. By card
Viewing the results by card works similarly, except this time you’ll see what categories each card was placed in and how many times. Under this view, you can see:
- card name
- total number of categories it was sorted into
- category names (what unique categories the card was placed into).
Tip: you can review the results in two other formats: ‘Similarity matrix’ and ‘Results grid’. They both open in a new tab and can be downloaded as a PNG or SVG.

c. Similarity matrix
This provides insights into the most closely related pair combinations. In other words, a similarity matrix shows the cards that participants paired together in the same group, the most often. You’ll be able to spot how frequently certain cards are placed together and whether there are any outsiders that often overlap with others.
The matrix will look something like this:

- The general rule of thumb: the darker the square, the higher the percentage of participants who tended to agree on the cards pairing together well. The colour legend will help you read the results.
- Focus on the clusters. We recommend drafting your website structure around the clusters with the higher percentages—they determine that 2 specific labels should definitely be grouped under the same category since they’ve often been placed together.
- Click each individual square to find out which cards are paired together the most often, and which ones are most infrequently paired together (if any at all).
d. Results grid
This is a table view that shows the number of times each card was sorted into your pre-set categories. The grid will look something like this:

- The categories are shown at the top of the grid.
- The cards are shown on the left-hand side of the grid.
- Hover over the card square to see the percentage of how many participants added it to a category.
Tip: look out for new categories if you’ve carried out a hybrid test (allowed participants to add their own categories).
You can spot the new categories made by the users with this folder icon:

The preset categories you, the researcher, have added are labelled with this folder icon:

Step 4. Review the open card sorting results
Next, it’s time to review the categories made and added by the users.
You can skip this step if you’ve chosen closed card sorting.
- You can view the results by clicking on the ‘Open card sorting’ tab.
- Like closed card sorting, you can view the results by card or by category.
If two or more users create the same new categories (‘Bread’ for example), then they’ll automatically combine and show as the same new category.
Tip: you can download an XLSX report to save all your results for future reference. That way the raw data will give you full flexibility to extract the insights you need.
Step 5. Examine introduction/conclusion questions
Lastly, take a look at the answers for your pre-test introduction questions and post-test conclusion questions.
For more information on how to analyse the results, check out our full guide.
Build your card sorting test today
Ready to build your card sorting test?
Start by joining the UserQ platform as a researcher and you can be testing in minutes.
Need a hand with building your test? No problem. Feel free to send us a message to: support@userq.com. We’re always ready and willing to answer any questions or queries you have about card sorting.
Related Post

Tree testing guide: How to
Want to build a fully functional tree test the easy way? Here at UserQ, we’ve got the tools you need

Tree testing guide: Analyse tree
You’ll have access to the results as soon as the tree test is published. The findings of your test show

Card sorting guide: How to
Want to build simple and easy-to-use card sorting tests? You can with UserQ. Our pay-as-you-go user testing platform allows you
Subscribe to our
product newsletter!
Receive emails about UserQ updates, new features,
offers and latest trends.


